- Posted by: blignos
- Published: 16-06-2022
- Category: Latest news
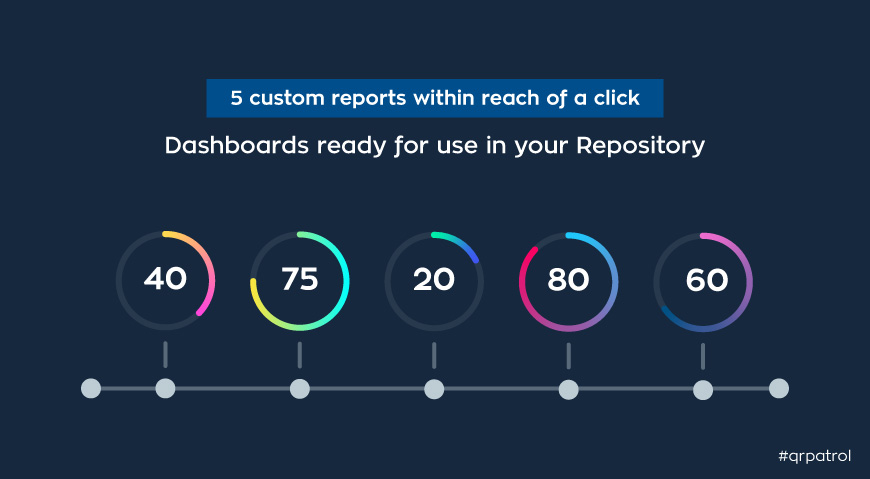
5 custom reports within reach of a click - Dashboards ready for use in your Repository
Current situation
Gathering your data at one place and managing them automatically, turning them into insights can be an everyday effort for your business. Take a breath, a small step back and think of how you’re doing that at the moment. Are there any ways for you to improve it? Maybe even automate it.
Why gather data, when you cannot turn them into insights, creating a tool, which can help you improve and automate your operations, in the first place.
Here are some issues and difficulties managers can face during their everyday operations, using paper reports or vast excel files which would definitely cause issues to your work’s productivity:
- 1 Papers cannot be shared and analyzed
- 2 Excel files are very hard to share and edit
- 3 They require tons of manual work
- 4 Risks and mistakes are very possible
- 5 They are not user friendly for your audit purposes
- 6 Where are you storing them? How do you search for data?
Your alternative
Do you have the GOLD version of QR-Patrol? Have you discovered the usiness Intelligence tool functionalities?
BI is a tool integrated into QR-Patrol enabling GOLD users to easily create their own custom reports and dashboards, based on their needs and requirements, with specific content like tables, pie-charts and bar-chars, utilizing all the available data of the system.
The best part is that now you can navigate to your BI repository and address a whole library of 5 different types of custom reports, that contains pre-built Dashboards and Reports relating to the Clients/ Incidents/Schedules.
The managers have a full visibility on their operations, being able to evaluate the current situation, detect any pain points and eliminate threat patterns that could pose risk to the business.
To access the Library, visit the BI tab, click “Repository” and then follow the path: Organization -> QR-Patrol -> Your Company -> BI Library. You will then find the following folders available:
- 1 Client Analytics
- 2 Incident Analytics
- 3 Schedule Analytics
Let’s take them one by one and see what’s inside.
1. Client Analytics
In this folder, we gather all the data related to the Clients, visualizing them into single dashboards, as shown below.
Through these dashboards, you can get a complete view of each Client's locations, and ultimately upgrade your services to them, providing complete transparency.
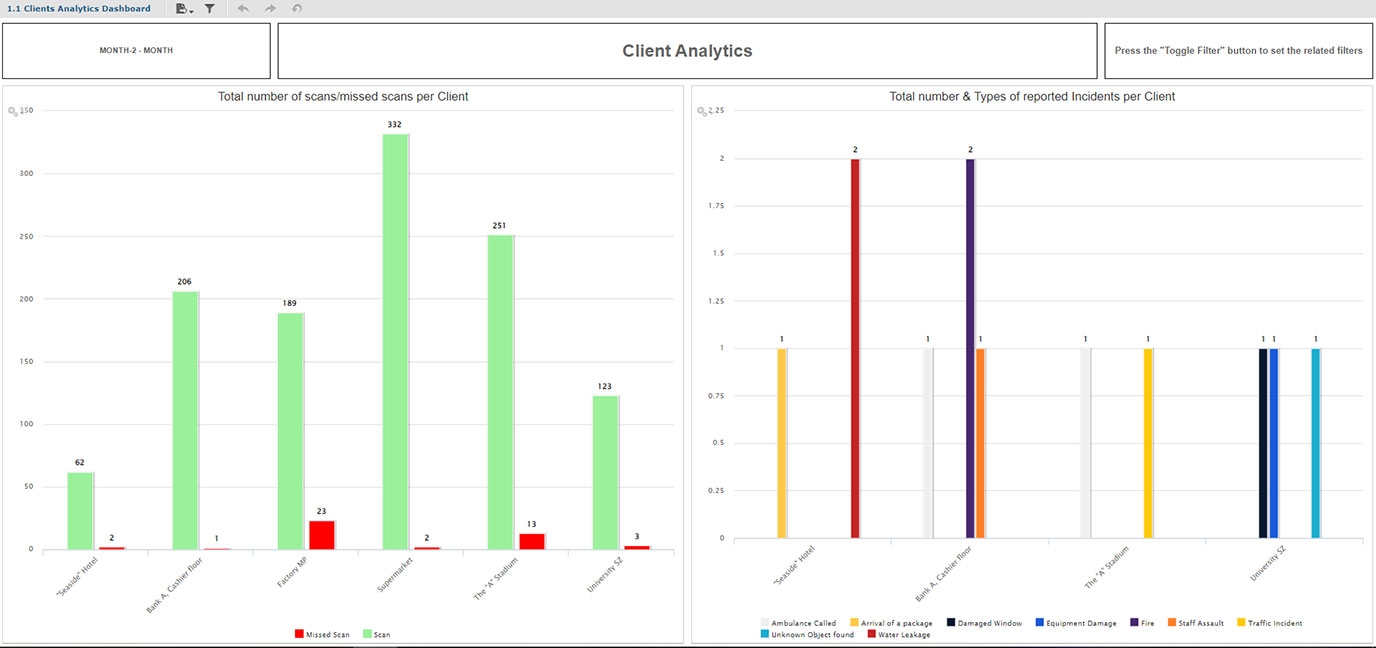
1.1 Clients Analytics Dashboard
More specifically, in this report, you can check: 1) the total number of scans/missed as well as 2) the total number and type of reported Incidents for all of your Clients/Sites, giving you an overall of what has happened to all of them.
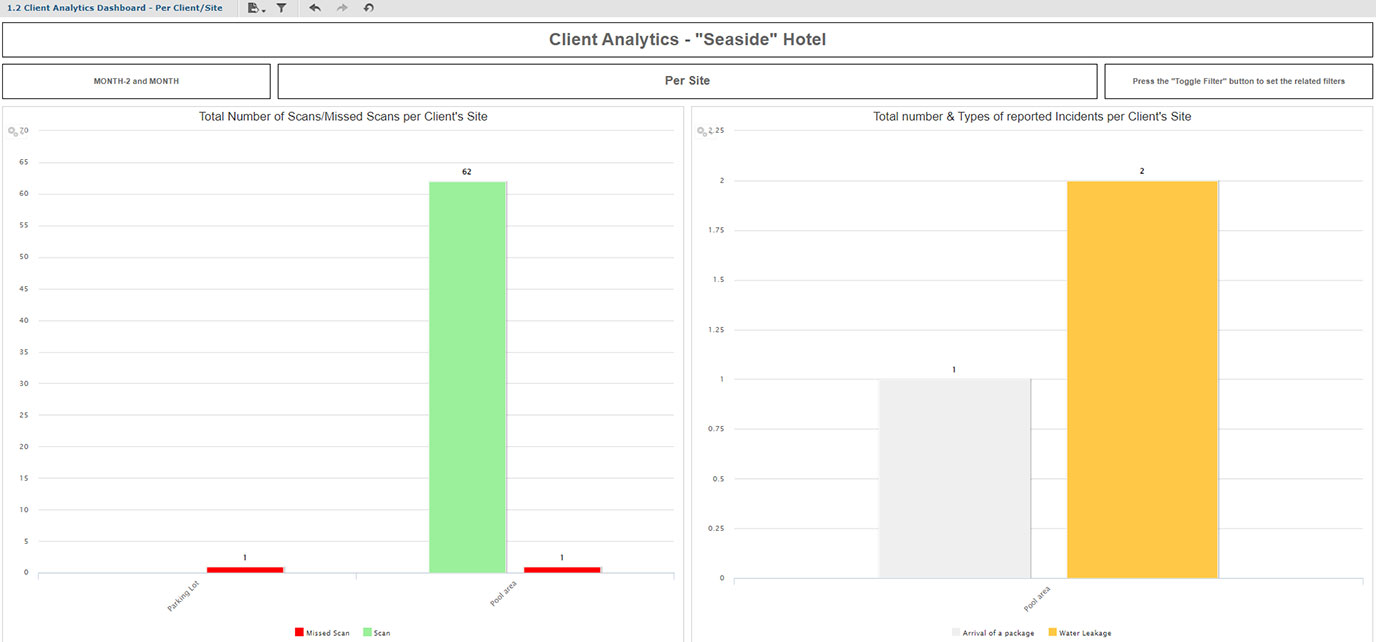
1.2 Client Analytics Dashboard – Per Client/Site
Similar to the one above, through this dashboard, you can check: 1) the total number of scans/missed and 2) the total number and types of reported Incidents, forone or more selected clients / sites, giving you a more focused picture.
2. Incidents Analytics
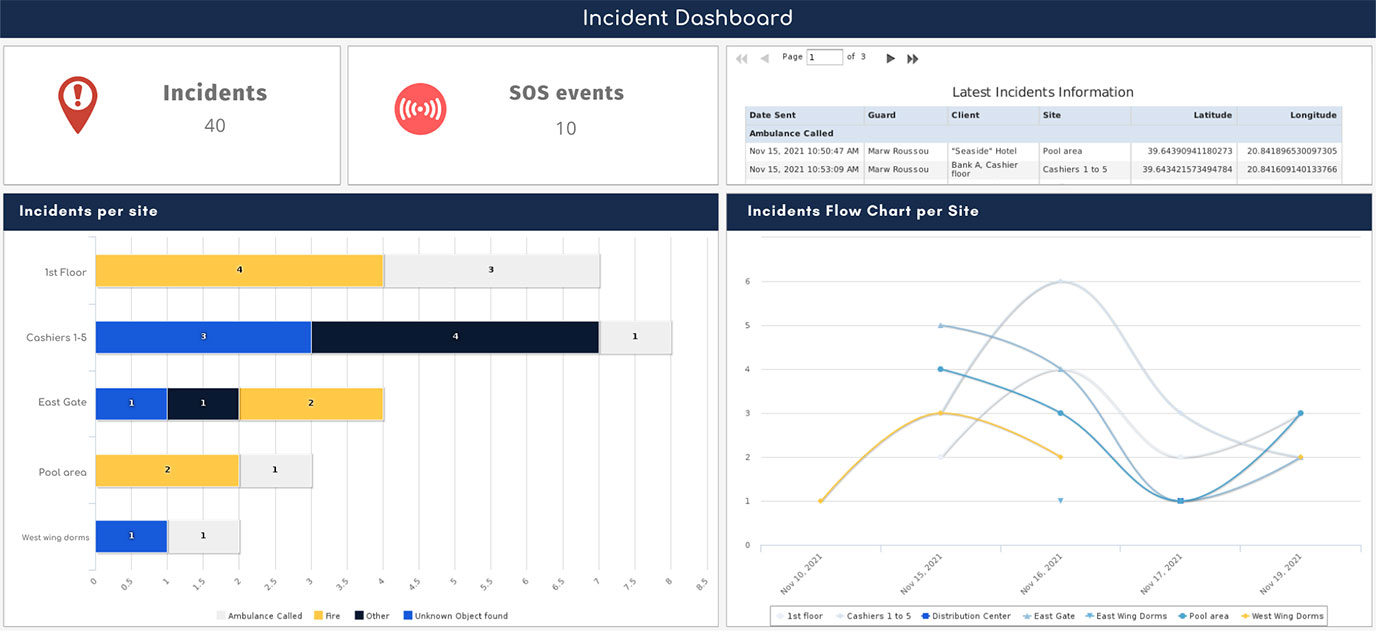
2.1 Incident Dashboard
This dashboard gives you an overview regarding the operations/incidents for your locations of interest.
Through the Table, the Bar chart and the Flow chart available within the dashboard, you will find information relating to the frequency of Incidents by type, related to specific Client locations and properties.
You can utilize the available data and make accurate and immediate decisions to resolve any issue that may arise.
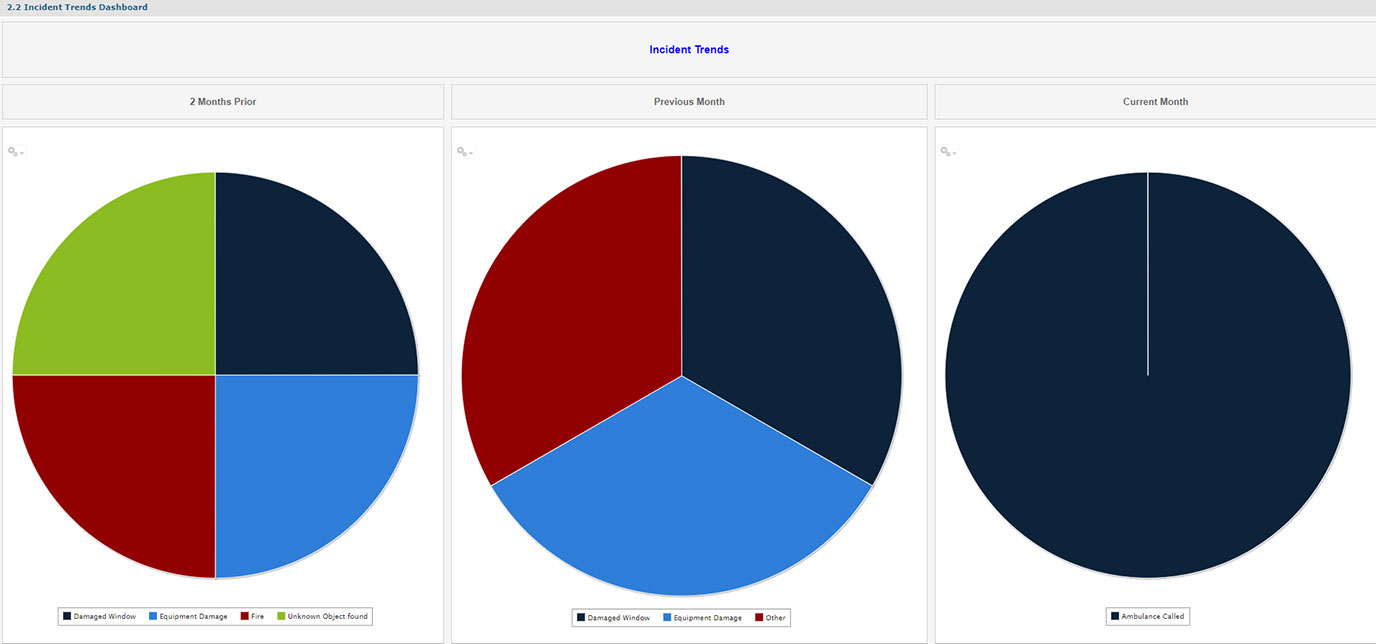
2.2 Incidents Trends Dashboard
This dashboard is used to check the Incidents trends (upward/downward) over the last 3 months.
You can easily visualize into pie charts: 1) what types of Incidents have occurred and 2) their respective frequency of occurrence during the last 3 months related to the selected Client(s).
This gives you the ability to be proactive and prepared for the most frequent incidents and react with minimum delays.
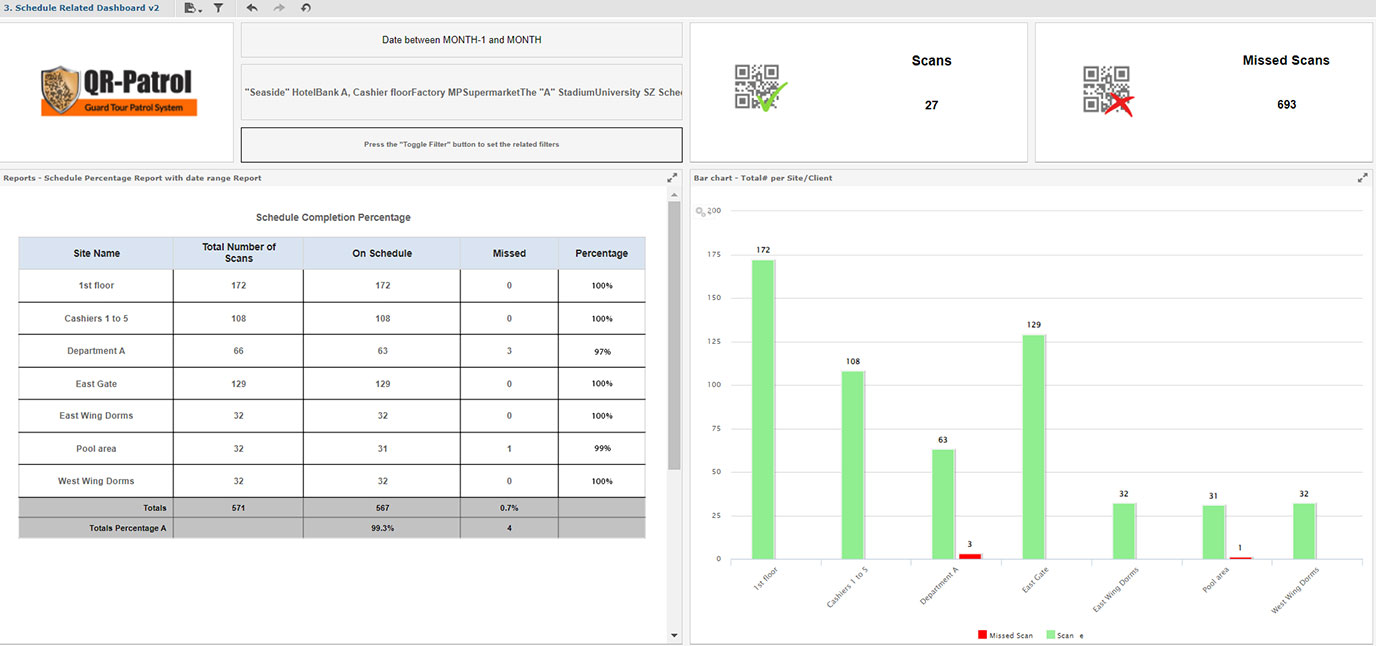
3. Schedule Analytics
This is a Schedule-related dashboard aiming to provide information about the completion rate of each Schedule (scans/missed scans).
Specifically, it includes: 1) the total number of Scans/Missed Scans, 2) a table with the percentage of Schedule completion (On-Schedule Scans vs Total Scans performed) and 3) a bar chart with the on-schedule/missed scans per Site and Schedule, related to the selected Client.
The dashboard serves as a decision-making tool, saving you valuable time and allowing you to efficiently monitor your everyday operations.
Don’t waste time, take advantage of your GOLD account and all its BI capabilities!
Last but not least, even if you’re not a GOLD user you can benefit from the library by upgrading very easily or just ask us to create a custom report for you as an add-on into your account, regardless your plan.
If you have any related questions on the above or need any further assistance, please contact us at any time at success@qrpatrol.com.
Written by Maria Vlachou in collaboration with Pavlos Sopikis